The baby boomers now retiring grew up in a high returns world. So did their children. But, as Credit Suisse notes in their 2013 Yearbook, everyone now faces a world of low real interest rates. Baby boomers may find it hard to adjust. However, McKinsey (2012) predicts they will control 70% of retail investor assets by 2017. So our sympathy should go to their grandchildren, who cannot expect the high returns their grandparents enjoyed. From 1950 to date, the annualized real return on world equities was 6.8%; from 1980, it was 6.4%. The corresponding world bond returns were 3.7% and 6.4%, respectively. Equity investors were brought down to earth over the first 13 years of the 21st century, when the annualized real return on the world equity index was just 0.1%. But real bond returns stayed high at 6.1% per year. We have transitioned to a world of low real interest rates. The question is, does this mean equity returns are also likely to remain lower. In this compendium-like article, CS addresses prospective bond returns and interest rate impacts on equity valuations, inflation and its impact on equity beta, VIX reversions, and profiles 22 countries across three regions. Chart pr0n at its best for bulls and bears.
Over 113 years, the relative size of world stock markets has shifted significantly…
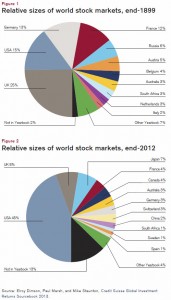
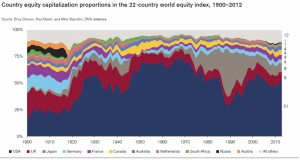
But the changes have been very cyclical…
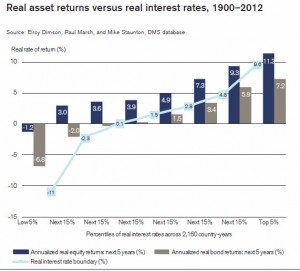
The last 13 years have been somewhat special… as real yields around the world have collapsed…
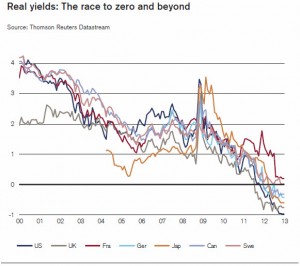
and that has historically tended to mean low equity returns…
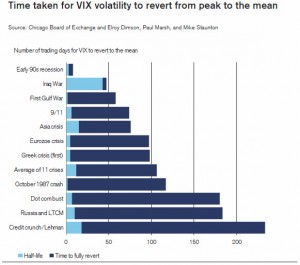
The busts of the dot-com era, LTCM & Russia, and Lehman/Credit Crunch had a very different profile to previous risk flares in VIX…
and while they suggest that mean-reversion has provided upside potential for stocks (in the past, staying in stocks at the start of the year when real rates are negative has proved a better bet that exiting), the concept of a shifted world paradigm (see VIX and global real rates) suggests perhaps it is different this time.
And the argument of equities as an inflation hedge is flawed due to its non-linearity…
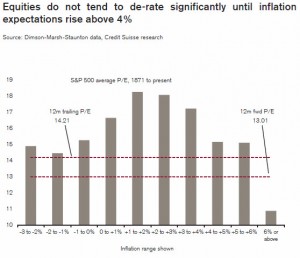
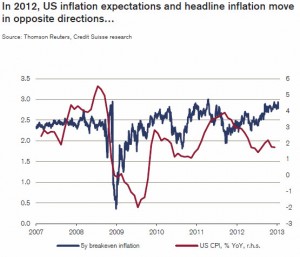
Though valuations at the current inflation expectations seems to be ‘cheap’, one can only question the actual inflation expectations… as the official spot data diverges from market expectations…
And as CS notes, extrapolating from such a successful market can lead to “success” bias. Investors can gain a misleading view of equity returns elsewhere, or of future equity returns for the USA itself.
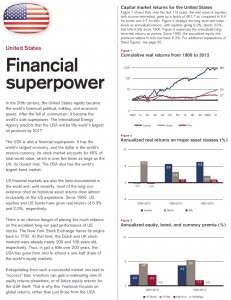
until recently, most of the long run evidence cited on historical asset returns drew almost exclusively on the US experience. Focusing on such a successful economy can lead to “success” bias. Investors can gain a misleading view of equity returns elsewhere, or of future equity returns for the USA itself. The charts opposite confirm this concern. They show that, from the perspective of a US-based international investor, the real return on the world ex-US equity index was 4.4% per year, which is 1.9% per year below that for the USA.
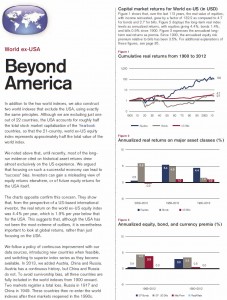
But what is clear from the above charts, in the 50 years since 1963, Bond and Stock returns are far more similar than different, no matter what your RIA tells you..
Because, it’s fiscally – for the USA – very different this time…
