People are going to see moves in gold that will shock them. Some of the advances will be spectacular, but right now people are focused on short-term weakness so they are missing the big picture. – John Embry, King World News
The U.S. media is oozing with bearish reports offering up every reason imaginable as to why the bull market for gold is finished and why gold is entering a bear market. Several Wall Street banks have put a proverbial “fork” in gold. Tuesday morning Bloomberg News published the latest death proclamation, explaining that big sales by investors are signaling the end of gold’s bull run: “Gold’s 12-yr Bull Run Decay.”
The Bloomberg article contained several incorrect statements concerning the gold market, prompting me to look at the true facts. Furthermore, and ironically, Bloomberg’s thesis about investor bearishness – in fact – supports the contrarian argument that the best time to buy into the gold market is indeed when hedge funds are positioned at their most bearish.
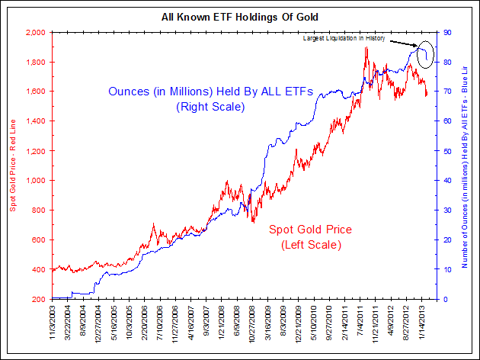
To begin with, Bloomberg references the fact that investors have sold a record amount of GLD since the beginning of February. And indeed this is true. Taken out of context, that number looks ugly. However, it is very important to understand that, relative to the total size of GLD, the recent drop in holdings is quite small. This chart – courtesy of Bianco Research – shows the drop in ETF holdings in its proper context:

As you can see, the current drop in total ETF gold holdings is visually the largest on record. But in the context of the overall ETF gold holdings it is not significant. You can also see visually that when large drops in ETF holdings have occurred (late 2008, for instance), the drop correlates with a subsequent big move higher in the price of gold. Furthermore, the biggest liquidation of GLD began on February 20, when the price of gold was $1564. The price today is $1592. The point is, the price has actually climbed higher since GLD began heavily liquidating. This is actually very bullish, as the market has absorbed the 4 million ounces of gold liquidated from GLD while grinding higher. Makes you wonder who is buying the gold being liquidated.
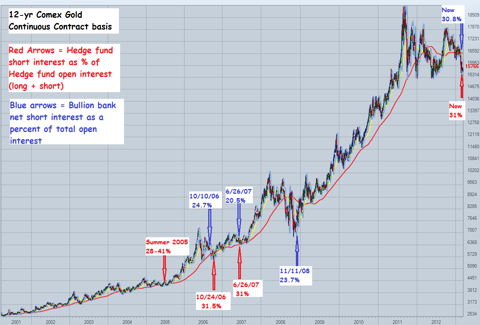
The second issue misrepresented by the Bloomberg article has to do with the bearish stance on gold taken by the large hedge funds, as represented by their short interest position in Comex gold futures. The Bloomberg article linked above indicates that the hedge fund positioning is the least bullish since 2007, implying that it’s a big negative for the price of gold. But let’s review the facts and evidence, as shown in the chart below:

This chart is a 12-yr Comex gold futures chart which highlights when the large hedge fund short interest as a percentage of the total hedge fund open interest (short position/(long + short position) has been at particularly high levels (red arrow) over the last 12 years. It also shows the commercial/bullion bank net short position as a percentage of total interest, when this metric has been at particularly low relative levels over the last 12 years. It makes sense that a high speculator/hedge fund short position would correlate with a low relative net short position for the banks, as the banks take the other side of hedge fund position (futures are a zero-sum game).
As you can see, and contrary to what is implied by the Bloomberg report, whenever the hedge funds have a high relative short position in gold – and concomitantly the banks have a low relative short position in Comex gold – the subsequent move in the gold market has been an explosive rally.
After the summer of 2005 (see the red arrow above), gold ran up over 60% in about 8 months. After the 2007 bearish positioning by hedge funds referenced by Bloomberg (see the red arrow), gold ran up another 60% over the next 9 months.
The point here is that, based on the evidence and hard data, whenever hedge funds get excessively bearish on gold based on their Comex short interest, it tends to mark the end of a large price correction and the start of a monster rally. Remember, hedge funds almost never deliver, or take delivery of, actual physical gold. This means that if the price starts to go against them, they’ll rush to cover their short positions, triggering a big short-cover rally.
As you can see from the far right side red arrow, the hedge funds currently are as short Comex gold as they have been at any time over the last 12 years. It remains to be seen if history will repeat and we get another massive rally. One huge factor that is affecting the market now that was not a factor back in 2005 and 2008, however, is the massive accumulation of physical gold by China and Russia, among other countries. My bet is that this will amplify the degree to which gold moves higher this time around.
If you want to take advantage of the view that hedge funds are wrong once again, the best way to speculate on gold is to use GLD to index the price. In fact, the most aggressive play would be to buy some longer-dated, out-of-the-money call options. I like the GLD June 165′s for $1. A 10% rally in the price of gold before the June options expiry would put spot gold at $1750, which corresponds with $169 on GLD – yielding a 400% profit on the play.


