“The returns of cash are terrible. So as a result of that, what we have is a lot of money in a place — and it needed to go there to make up for the contraction in credit — but a lot of money that is getting a very bad return. That, in this particular year, in my opinion, will shift. And the complexion of the world will change as that money goes from cash into other things. ” — Ray Dalio, Bridgewater Associates
The dramatic breakdown in the real rate of return* on dollar-based savings instruments is perhaps the most important financial event of the past decade; save perhaps gold’s rise as its most effective countermeasure. The absence of a real rate of return makes it impossible to preserve, let alone grow, wealth by traditional means. It destroys incentive and nurtures a culture of economic uncertainty. It promotes speculation and undermines the existing social contract. It makes it difficult for the federal government to obtain financing and for individuals to plan a comfortable retirement. In short, the problems associated with a negative real rate of return run deep and create an environment in which gold demand flourishes.
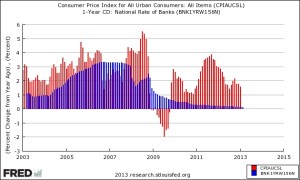
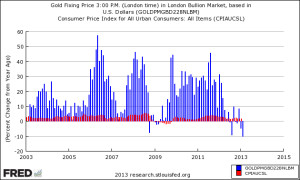
As illustrated in the first chart below, the real rate of return on dollar-based savings has been dismal over the past decade. By comparison gold’s real rate of return, as shown in the second graph, has been nothing short of spectacular. In the process, gold owners have not just preserved savings during the uncertainties of the past decade, they have actually built wealth in real terms — no small accomplishment. Thus the trend indicated in the first chart serves as an effective argument for a continuation of the trend demonstrated in the second chart.


In this context, Fed chairman Ben Bernanke’s constant assurances that his easy money policies will continue at least until 2015 are cause for concern. Currently those who save in dollars at the bank are losing money in real terms at the rate of roughly two percent per year. Money in the process is losing one of its principle attributes. It is no longer considered a reliable store of value. Ray Dallio, the highly respected founder of Bridgewater Associates, the world’s largest hedge fund, completes the thought posted in this month’s masthead quote. He names gold as one of those other things:
“I think that their next move will be, as described, a move from liquidity to purchases and then we have a shift…I think the shift of the cash, that massive amount of cash will be a game changer — into stocks, into everything. It will mean more purchases of goods and services and financial assets. It will be into equities, it will be into real estate, it will be into gold, it will be into a lot of….just basically everything.”
Though money pumped into the economy acts like a high tide that raises all boats, it can also result in a tidal wave of uncontrolled inflation and out-of-the-box negative real rates of return. Wealth will be won and wealth will be lost in the years ahead as the cash to things scenario unfolds. How savers position themselves will make all the difference as to which side of the wealth scoreboard they find themselves. The defining question comes down to this: “What’s your real rate of return?”
*Real rate of return equals the yield minus the inflation rate.
_______________
Chart Notes:
(1) I used the one-year certificate of deposit as a bellwether simply because the average investor is reluctant to commit capital to longer term instruments in a zero percent interest rate environment. (2) Many believe the BLS’ Consumer Price Index understates the inflation rate. If one were to use the Shadow Government Statistics’ data model, for example, the negative real rate of return would be far worse than the one shown in the first chart. SGS utilizes the same methodology the BLS employed prior to 1980 before it introduced hedonic adjustments. (3) Taxes were not taken into account in either chart. (4) In the first chart, the extension of the red bars over the blue bars indicates the negative real rate of return on the one-year CD. In the second, the extension of the blue bars over the red bars indicates the positive real rate of return on gold. (5) Monthly data, per cent change from year ago. With thanks to the St. Louis Federal Reserve.


