As the Banks & Brokerage Houses continue to forecast the tapering of the QE by the end of 2013 or beginning of 2014, the only choice the Fed will have will be to increase not decrease monetary stimulation. QE 5 is coming because U.S. economic indicators continue to disintegrate.
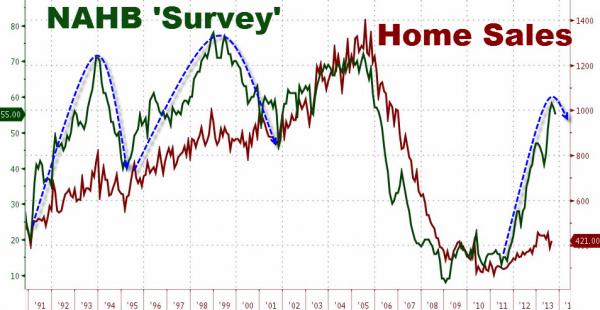
According to a recent post by Zero Hedge, “The ‘Oh Crap” Moment For Housing is in the Can”, Mark Hanson stated the following:
1) US Pendings Fell 21.1% MoM on an NSA basis (down more not including last month’s revision), the most on record for any Sept since Sept 2001…that’s a terrible period to comp against.
2) On a YoY basis Pendings were down 4.3% on a daily basis (Sept 2013 had 1 extra business day YoY). And remember, in Sept demand was still being pulled forward due to rates and fear of Gov’t shutdown.
3) Levels of Sept Pendings virtually ensure Oct through April Existing Sales” are lower YoY. A year ago volume outperformed (muted seasonality) in winter & spring, as new-era “investors” all dove in at the same time. This year the market will underperform (heavier than normal seasonality) due to the stimulus “hangover”. This delta will produce meaningful YoY Existing Sales declines especially through April 2014.
4) Leading indicating Western region absolute Pending Sales lowest since 2007.
5) Heavily weighted, leading-indicating Northeast & West Sept Pendings down 31% & 20% MoM NSA respectively, also 12-year record drops.
6) YoY, Northeast & West Pendings down YoY by 3.1% and 5.2% respectively…the first YoY drop since after the 2010 sunset of the Homebuyer Tax Credit.
7) MoM, Sept national Pendings dropped 54% and 40% more than the 10-year average and post housing market crash avg Sept respective seasonal drops.
In just one month September pending home sales fell 21% month over month, the most since September 2001.
Furthermore, Hanson states:
Along with this comes lower YoY Existing and New Sales volume along with down trending MoM house prices as far out as July 2014, at which point house prices have a good shot at being negative YoY as well.
The Fed has made it perfectly clear during its FOMC meetings that it will not change its QE policy unless employment and economic indicators improve. Here we can see that one of the major indicators, home sales, is heading straight into the toilet.
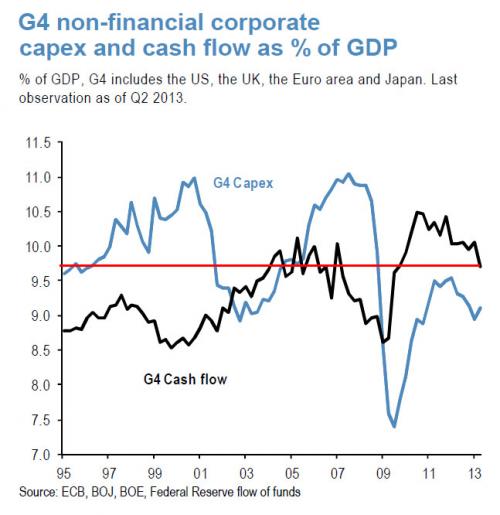
Furthermore, corporate cash flows have fallen to 2009 levels (Zerohedge article):
The last time we looked at global corporate cash flow and capex as a percentage of G4 (US, UK, Europe and Japan) things were bad. Two quarters later, things have gotten much worse, with that purest proxy of true growth, or lack thereof, corporate cash flow (and notfudged, adjusted, normalized, pro forma earnings), sliding yet again tracking the ongoing collapse in capex, and now down to levels last seen during 2009, and what’s worse going further back, all the way back to 2003 levels. In other words, even when taking into account the tens of trillions of liquidity injections by global central banks to prop up capital markets, the flow through to actual corporate cash flow has been non-existent, and the entire past decade is now a scratch despite the global asset price bubble rising to unprecedented new heights.
Here we can see that things aren’t getting any better, but rather much worse. The Fed will have no choice but to increase its monthly QE purchases or the economy will really crater in 2014. So, for the notion that the Fed will taper its QE policy in the immediate future its pure Bollocks.
Precious metal retail investors are starting to catch a whiff of this as Gold Eagle sales purchases have picked up significantly in the past month. Part of this reason for the increased buying of Gold Eagles may have been due to the Govt shutdown and the on going Debt Ceiling debate, but investors have been snatching up the official coins at a rapid pace in the past few days.
As I mentioned in my prior post, “TRICK OR TREAT: Fed Smashing Gold & Silver while 2,000 Gold Eagles Were Sold”, 2000 Gold Eagles were sold just on Thursday, Halloween and in addition another 3,000 more were sold on Friday, Nov. 1st.
Something has motivated the retail investors to purchase Gold Eagles again. Even though the price of gold fell $40 last week, it dropped even further in September when went from a high of $1,400 to a low of $1,325 — the month in which sales were only 13,000 oz.
Lastly, in his most recent interview, Jim Sinclair stated that the price of gold could hit $50,000. The reason for his call was due to the “Emancipation of physical gold from paper.” Furthermore, Sinclair states that the coming hyperinflation in the United States will not be due to an economic condition, but rather a currency event — a loss in the confidence of the Dollar.
The Fed can’t stop its QE purchases or the whole house of cards comes crashing down. Marc Faber stated that the Fed purchases could rise to a $trillion a month. Who knows if we ever get to that amount, but before we do…. QE 5 is on its way.
There is only a fraction of physical gold and silver to back up the massive amount of paper claims. As QE heads to infinity, it will most certainly push the precious metals up to new highs never seen before.


