An Analysis of Gold Bull & Bear Markets From 1972 to 2013
Here are the historical Gold bull and Bear Markets Since 1972 through 2007.
“Since 1972 to 2007 there have been 14 bull and 13 bear market cycles (20% rises/declines preceded by a 20% decline/rise). The average bull market in Gold has lasted 434 days with gains of 94.89%. The average bear is a bit longer at 538 days with average declines of 33.37%.”
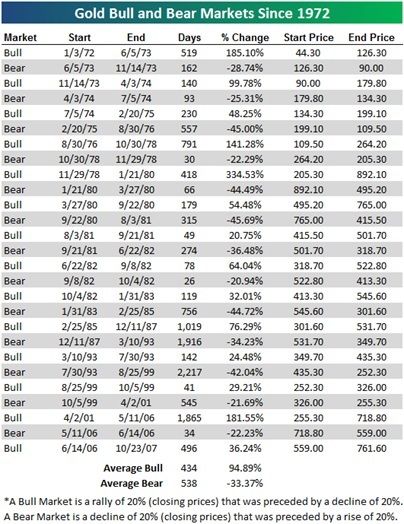
Above Table Courtesy of SeekingAlpha.com
Analysis Of The Gold Bull & Bear Markets since 1972
If we assume the present GOLD BEAR MARKET may have recently bottomed at its 61.8% Fibonacci Support level at $1,186, then it will have corrected -38%, which compares well with the AVERAGE RANGE BEAR market decline since 1972. The range of gold’s bear market declines was -21% (September 1982) to -46% (September 1980). And the average of the two range extremes is -34%, which is comparable to the current -38% bear decline. Moreover, the present gold bear market is already long in the tooth as it is recently over 700 days old vs the average of 538 days since 1972. However, there were three gold bear markets that lasted longer: 756 days (January 1983; 1,916 days (December 1987), and; 2,217 days (August 1993). Indeed and fact the present gold bear market is already very mature…and looking to rally in the near future.
Gold Price Forecast Based Upon Gold Bull & Bear Markets History since 1972
The average bull market in Gold lasted 434 days with gains of 94.89%. Projecting this historical average to the upcoming bull market, one might see the shiny yellow top $2,315/oz by March 2015.
Gold Bears Watching….pun intended
Other Cardinal Factors That Support The Hypothesis Of Another Gold Bull Market Are:
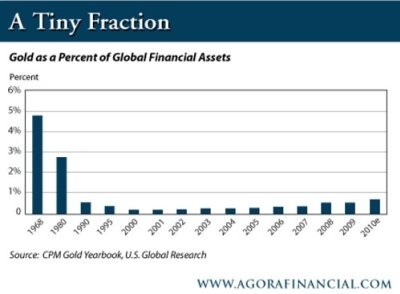
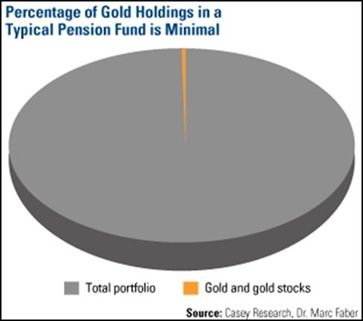
Very few investors in the entire world have claim to gold protection. Admittingly, the following information is overtly redundant proof that preciously few smart investors have the protection that gold affords. However, gold’s future spectacular performance will vindicate this author’s over emphasis. In all cases the charts are self-explanatory.
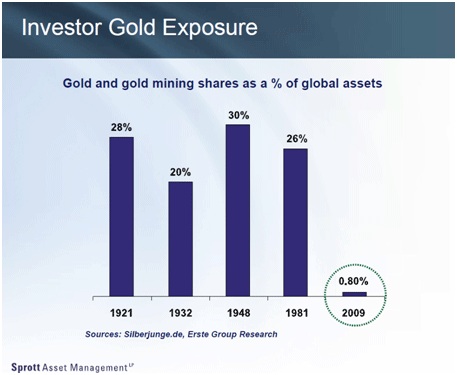
The following chart is mind-boggling as it shows how much gold and gold mining stocks represented as a percentage of total global assets in earlier decades. Specifically, gold and gold mining stocks represented 28% in 1921, 20% in 1032, 30% in 1948 and 26% in 1981. In sharp contrast today it is less than 1% !!!!
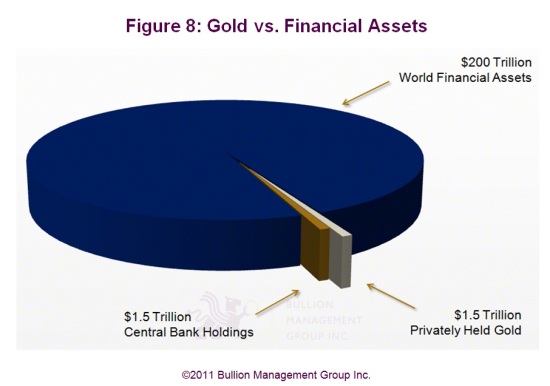
Global institutional pension fund assets in the 13 major markets grew by 9% during 2012 to reach a new high of US$30 trillion, according to Towers Watson’s Global Pension Assets Study released early this year. This is a virtual ocean of money…which may someday stampede toward higher performing investments in gold, silver and precious metal equities.
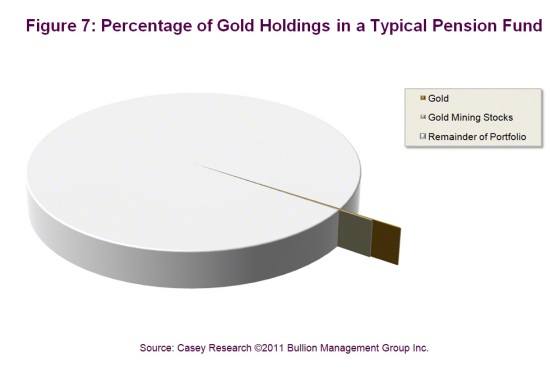
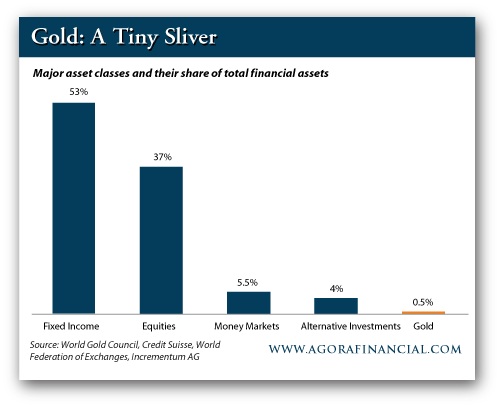
Let’s step back and ask how much of the world’s wealth is tied up in gold. According to figures compiled by German economist Ronald Stoeferle, the cumulative value of all global financial assets amounted to about $223 trillion at the end of 2012. Of that very big number — nearly 14 times total U.S. gross domestic product — the share of “investable gold” currently totals $1.1 trillion, or a mere 0.5% of cumulative global assets.
Not much golden glitter compared with bonds, stocks and such. In other words, for all the gold that’s out there — in national vaults, funds, insurance companies, with institutions, sitting in people’s safe-deposit boxes — it’s just a tiny fraction of the cumulative value of other financial assets across the world. Herr Stoeferle’s figures are even more remarkable when you compare the percentage of gold holdings today (0.5%, see above) with what they were back in 1981, when gold made up about 26% of global assets. Or go further back to 1948, just after World War II, when gold comprised 30% of total global financial assets. The point is that if gold ever reverts to anything even close to its past significance as a fraction of the world’s total financial assets, the upside could be a skyrocket rise in price.
In essence practically no one since 1949 has enjoyed the adequate protection one needs to provide long-term preservation of purchasing power for the family’s savings, retirement and accumulated wealth. Needless to say this minuscule One Percent Of Total Assets in gold will explode to 15% to 20% as major countries foment high inflation to fuel their country’s economic growth…indeed to stave off deep recessions and/or even avert a 1930’s-like Deep Depression.
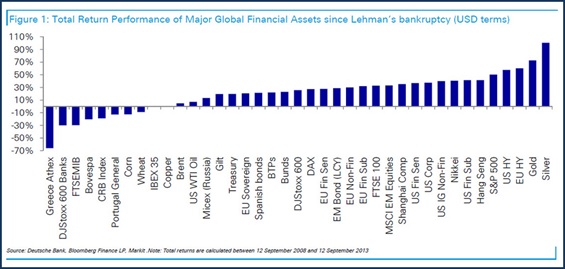
Silver and Gold Are The Best Performing Assets Since Lehman Brothers
(Source: Goldbroker.com report of September 17, 2013)
Last September marked the five-year anniversary of the collapse of Lehman Brothers (September 2008). A good moment to size up how well global markets have recovered.
According to Deutsche Bank, the total return performance of Major Global Financial Assets shows that Silver had the highest percentage gain. Gold takes the second position amongst these global financial assets. Effectively, silver has outperformed all of the financial assets as well as the major commodities such as copper, Brent Crude, corn and wheat. What is even more amazing is that silver has still taken the number one position even though its price has fallen 56% since its high in May of 2011.
If gold successfully retests the 61.8% Fibonacci level…
The long-term monthly chart of gold clearly shows it is in a secular bull market that started in 2001, reaching its all-time high of $1,921/oz in September 2011. Since then the shiny yellow has been undergoing a normal consolidation. Moreover, if gold can hold above its 61.8% Fibonacci level ($1,186), then it will most probably again begin to rise and eventually forge a new all-time record high sometime in 2014.
http://stockcharts.com/h-sc/ui?s=$GOLD&p=M&yr=14&mn=0&dy=0&id=p18022169387&a=186795475
Help From The U.S. Fed
To be sure the nomination of Dr. Janet Yellen to replace Ben Bernanke at the Fed will give impetus to the price of gold…as Yellen is a known inflationist. It is believed by some market pundits that a new chapter in QE will emerge in 2014…with a view to facilitate and fuel the economy higher AND BRING DOWN THE UNACEPTABLY HIGH UNEMPLOYMENT. Dr. Yellen is known to have said inflation can be higher with the objective of reducing unemployment.
Gold Bears Watching….pun intended
Other Fundamental Factors Supporting A Bullish Gold Forecast:
Because of the pervasive communication power of the Internet (aided by TV networks finally becoming aware of GOLD and SILVER’s outstanding performance), it is logical and reasonable to expect that Global Asset Allocation to GOLD will grow exponentially going forward. Moreover, added impetus for GOLD INVESTMENT GROWTH will be fueled by other factors, such as:
- Growing number of new Silver & Gold ETFs (In U.S., Euro Union & China)
- Increasing number of Central Banks diversifying FOREX Risk by buying GOLD (especially China)
- Greatly increased media advertising of precious metal products
- Currency wars throughout the world, thus debasing the value of their money
- More implementation of Yellen Quantitative Easing in the US, Euro Union and Japan
- Insatiable growing demand of China and India for gold and silver (world’s #1 & #2 consumers)
- Word of mouth advertising to family and friends, thus increasing overall demand
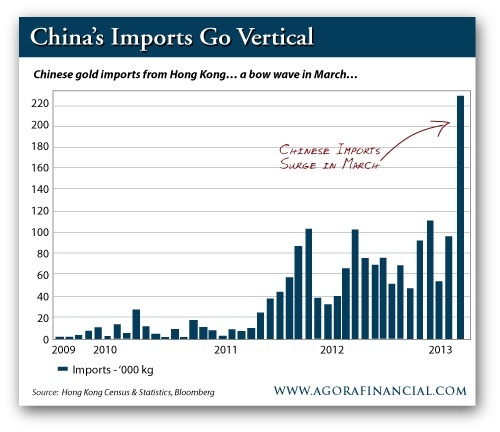
 China’s Irresistible Gold Rush
The year to date net gold imports from Hong Kong to China total 967 tonnes. That is an astonishing amount. To put this figure in perspective: the global production in 2012 was close to 2500 tonnes and the U.S. (having the highest gold reserves in the world) has 8133 tonnes of gold reserves.
Banks Buying Bullion
Central Banks Will Help Forge The Future Price Of Gold:
http://www.gold-eagle.com/article/central-banks-will-help-forge-future-price-gold
And above analysis of historical data, supported by current increasingly bullish fundamental factors reasonably suggests gold might logically top $2,315/oz by March 2015.
Gold Bears Watching….pun intended


