Today’s AM fix was USD 1,241.00, EUR 912.63 and GBP 754.68 per ounce.
Yesterday’s AM fix was USD 1,237.25, EUR 908.61 and GBP 757.19 per ounce.
Gold climbed $1.90 yesterday, closing at $1,240/oz. Silver slipped $0.12 closing at $20.10/oz.
Gold bars (1 oz) premiums are between 4.75% and 5.5% and are trading at $1,309.36. Gold bars (1 kilo) premiums are between 3% and 3.5% and are trading at $41,301.81. Premiums are steady.
Gold is marginally lower today after gaining yesterday on the U.S. inflation data that showed that the cost of living in the U.S. increased by the most in six months. This increased the appeal of gold as an inflation hedge.
Deutsche Bank announced today that it will withdraw from gold and silver benchmark setting, or the London gold fix process but remains “fully committed to our precious metals business.”
The bank is just one of the five bullion banks involved in the twice-daily fixing for gold price setting. Deutsche Bank plans to sell its gold and silver fixing seats to another member of the London Bullion Market Association, said a source. The bank says it is scaling back its commodities business.
The timing of the move is interesting as at the same time Germany’s top financial regulator, Bafin, has interviewed employees of Deutsche Bank AG as part of a probe of potential manipulation of gold and silver prices. Deutsche will be aware that the Libor-rigging scandal led to fines of about $6 billion.
Yesterday, Bafin said possible manipulation of currency markets and precious metals prices is worse than the Libor rigging scandal.
Elke Koenig, the president of Bafin, said in a speech in Frankfurt yesterday that the allegations about the currency and precious metals markets are “particularly serious, because such reference values are based — unlike Libor and Euribor — typically on transactions in liquid markets and not on estimates of the banks.”
Germans are the largest buyers of gold in Europe and in the western world due their experience of hyperinflation in 1922 and currency devaluation and economic collapse after World War II.
Many German banks in most German cities deal in gold coins and bars over the counter. If gold prices have been manipulated lower in recent months contributing to the 28% fall in prices in 2013, then the many gold buyers in Germany, not to mention buyers internationally, have been victims of this manipulation.
The strong line the German financial regulator is taking regarding manipulation of precious metal prices may be due to tensions between Germany and the U.S. over the significant delays in the repatriation of Germany’s gold reserves from the U.S.
Gold and silver manipulation “conspiracy theories” are becoming more conspiracy fact by the day.
Seven Key Gold Charts – “Bull Market Ahead”
Often “a picture paints a thousand words” and the seven key gold charts below should make gold bears nervous. The charts were compiled by Nick Laird ofwww.ShareLynx.com and emailed to us Wednesday night. Sharelynx.com is a great website for charts and well worth the subscription.
The seven gold charts suggest that there is a “bull market ahead”, as Nick says. Again, we may see some further weakness in the short term but the outlook is good for 2014 and the coming years.
So without further ado, lets look at these important gold charts.
Gold Chart 1 - The banks are long gold …

Gold Chart 2 - Gold stocks are being withdrawn …
Gold Chart 3 - Supplies are being held back …
Gold Chart 4 - COT Data shows that banks and others are positioned perfectly for a bull run to start … 
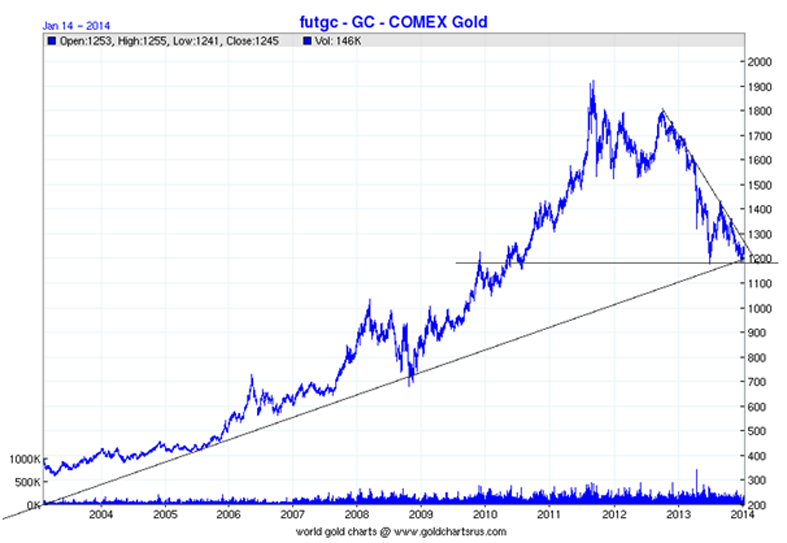
Gold Chart 5 - Pivot point time – double bottom …
Gold Chart 6 - Never been a better buy …
Gold Chart 7 - Just bounced off one of it’s most oversold phases …
Silver Chart - Silver double bottom …
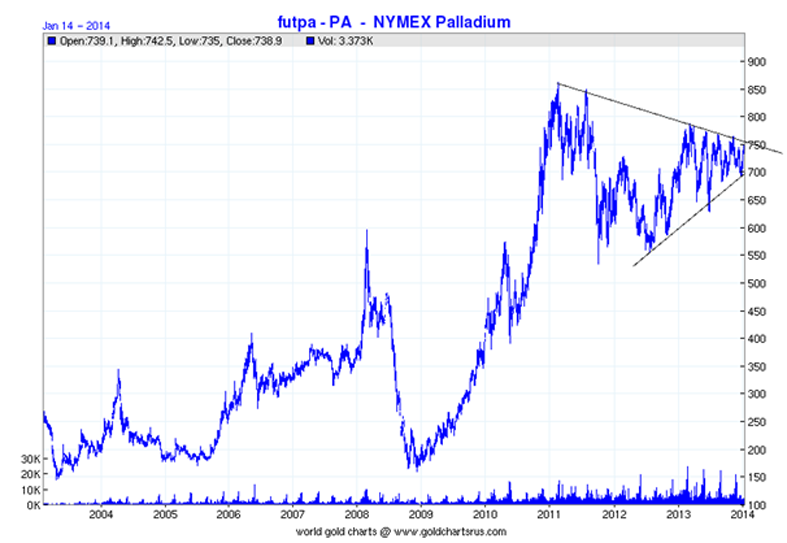
Palladium Chart - Time to breakout …

Platinum Chart - Time to get out of it’s funk …
Sentiment is as bad as we have seen it in the precious metals market. As the charts show, such sentiment, price action and oversold conditions tend to coincide with major lows in gold and silver prices and multi month price gains.
Very poor sentiment towards gold and oversold conditions is reminiscent of the conditions seen in late 2008 and January 2009 when gold prices had fallen by more than 25% in 9 months.
Subsequently, gold rose from a low on January 15, 2009 at $802.60/oz to a high less than 12 months later at $1,215/oz for a gain of over 50%. A similar move today would see gold above $1,800/oz by year end.
We believe similar gains may be seen in the coming months and years. Investors should position themselves accordingly.


