Not only did Canadian Maple Leaf sales shatter all records in 2013, their percentage gain was twice as much compared to Silver Eagles. The Royal Canadian Mint just released their 2013 Annual Report and sales of their Silver Maples were the highest on record.
You see, there’s a new Silver Sheriff in town, and it happens to be located north of the U.S. border. While Silver Eagle sales and growth were impressive in 2013, Silver Maples outgunned the competition by a wide margin.
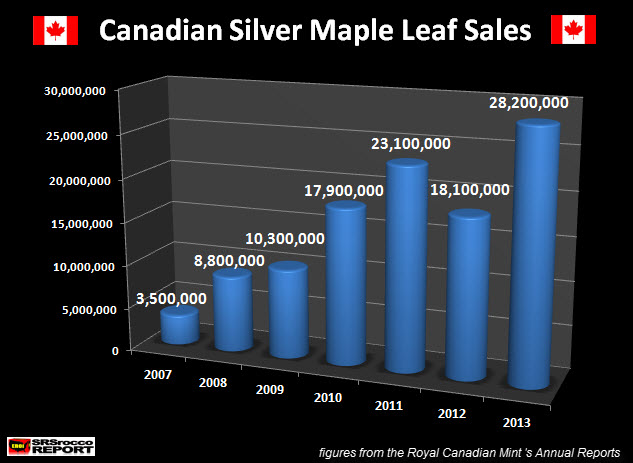
According to the data released by the Royal Canadian Mint, there were 28.2 million Silver Maples sold in 2013. This is an astonishing figure as it was a 56% increase over the 18.1 million ounces sold in 2012.
While the U.S. Mint increased its sales of Silver Eagles from 33.7 million in 2012, to 42.7 million in 2013… this was only a 27% increase year over year. However, the increase in Silver Maples sales were more than double (56%) the rate of Silver Eagles.
In just one year, Silver Maple sales at the Royal Canadian Mint increased 10.1 million ounces compared to the 9 million ounce gain of Silver Eagles from the U.S. Mint.
Furthermore, Silver Maples were higher by 5.1 million ounces (22%) in 2013 compared to their previous record of 23.1 million ounces in 2011. Silver Eagle sales on the other hand, grew much less in the same time period. Silver Eagles increased 2.8 million oz (7%) in 2013 compared to the 39.9 million oz sold in 2011.
If we combine the figures from the two strongest “Official Coin” sales in the world, we have the following:
Here we can see that Canadian Silver Maple sales grew tremendously in the past six years, from 3.5 million oz in 2007 to 28.2 million oz in 2013, while Silver Eagle sales increased from 9.9 million oz in 2007 to 42.7 million oz in 2013.
Basically, the sales of Silver Maples (8 X) grew twice as much as Silver Eagles (4.3 X) from 2007-2013.
Moreover, total sales of these two Official Coins in 2013 now represent 9% (70.9 mil oz) of total world silver mine supply, compared to only 2% (13.4 mil oz) in 2007. This is a significant figure. I’ve received comments on my site and emails stating that Silver Eagle and Maple Leaf sales aren’t that much of a factor.
I beg to differ….
I will be writing an article next week on WHY the sales of these Official Coins are putting a great deal of pressure on the market even though its not currently reflected in the paper price of silver.
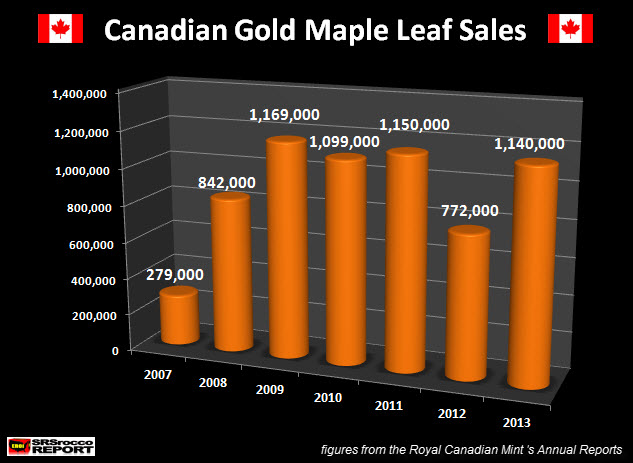
Lastly… not only did Silver Maple sales beat Silver Eagles hands down in percentage gains last year, the Royal Canadian Mint sold a great deal more Gold Maples than the U.S. Mint’s Gold Eagles. If we look at the chart below we can see Gold Maple Leaf sales over the past six years.
Gold Maple sales increased 48% from 772,000 oz in 2012 to 1,140,000 oz in 2013. Compare this to Gold Eagles sales which only grew 14%, from 753,000 in 2012 to 856,500 in 2013.
It seems like retail buyers are now favoring the Gold Maples over Gold Eagles due to their extra fineness and lower premium.
Retail investors are buying a great deal more Silver Official coins than they are gold. In 2013, total Silver Eagle & Maple sales were 70.9 million compared to the 1,996,500 oz of Gold Eagles and Maples. This is a 35.5/1 ratio compared to 28/1 in 2007.
Furthermore, Silver Eagles sales for the first four months of the year at 18.4 million are a 100 times greater than the 182,000 oz of Gold Eagles sold to date.
As soon as the Royal Canadian Mint releases their Q1 2014 report, I will publish an update on their sales figures. I would imagine 2014 Silver Maple sales are just as strong or stronger than Silver Eagles…. we will see.


